I Built a Client-Facing IT Health Dashboard in One Afternoon. Part 1: Claude.
Your client does not know what you do.
Not really. They know you exist. They know they pay you every month. They know to call you when the internet stops working. Past that, the work is invisible to them.
The patches. The monitoring. The tickets you resolved before they noticed there was a problem. The security alerts you triaged at two in the morning so they slept through it. All invisible.
That is not a service problem. It is a visibility problem. And it is killing renewals across the entire MSP industry right now.
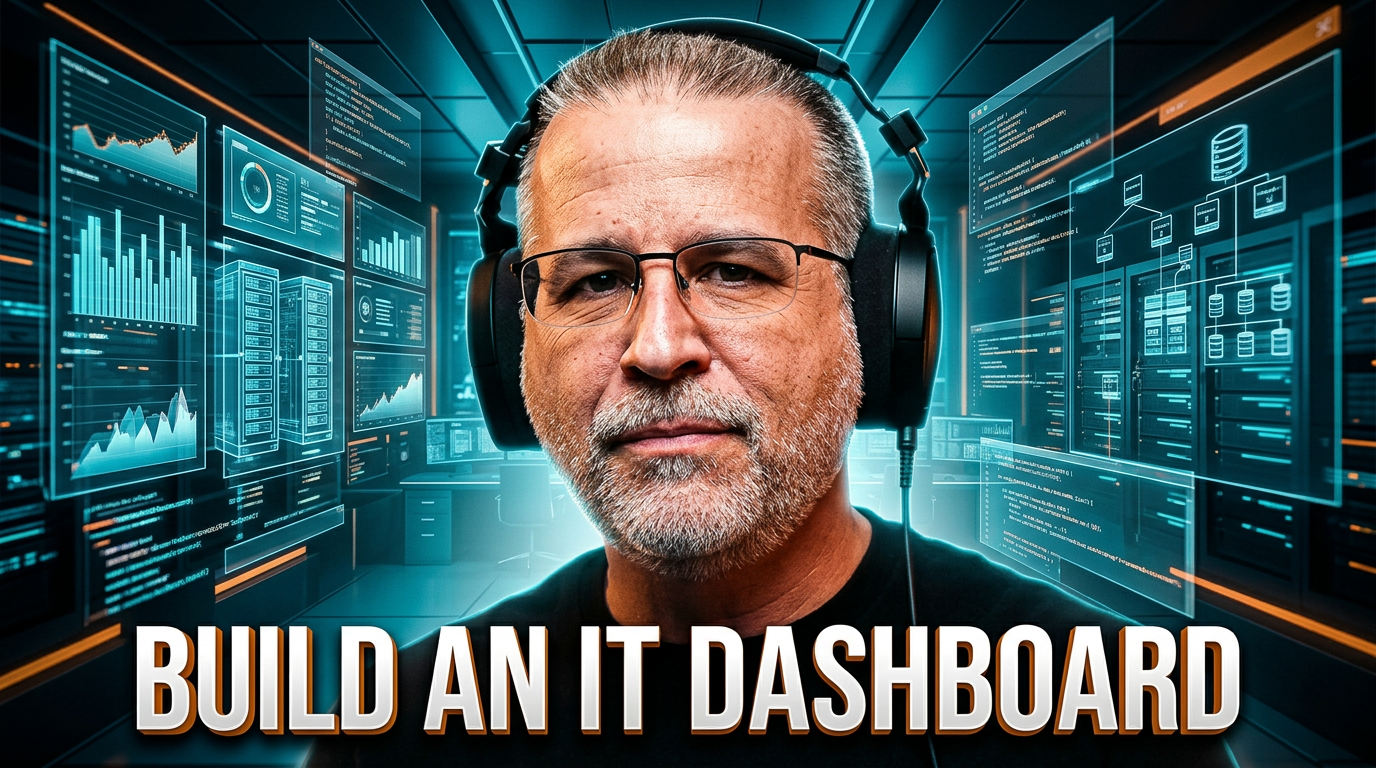
I built something this week that fixes it. A client-facing IT health dashboard. One afternoon. Claude. No developer. No platform license.
Here is the build, why it matters, and the four prompts that did the work.
Your Value Proposition Is Silence
Walk through the math from the client's seat.
They pay you a recurring fee. The internet works. Email flows. The printer behaves. Their team gets through the day without interruption. They never hear from you.
Then budget season hits. The CFO asks if they really need the IT contract. The owner cannot point to anything specific you have done in the last quarter. The work was invisible by design. Silence was the deliverable.
That is when the call comes. "We are looking at our IT spend this year and I just want to understand what we are paying for."
You can answer that call by listing your services. Or you can hand them a dashboard.
The dashboard wins every time. Because the dashboard does not require the client to understand what proactive monitoring means. It shows them. Last patch ran. Uptime ninety-nine point seven percent. Three open tickets, two low priority, one medium. Security score A. The trend line over thirty days, climbing.
Now they can see what they are paying for.
That is not a hypothetical fix. That is the move that flips renewal conversations.
The Visibility Tier Most MSPs Cannot Afford
Most platforms that solve this run two hundred dollars a month per client. They take a developer to set up. They hold your data hostage if you ever want to switch.
If you are running ConnectWise, NinjaRMM, Datto, or any of the platforms that already do this, keep using them. This is not a replacement conversation. This is not a security architecture rebuild. The point is not the vendor.
The point is the capability.
What I am about to show you requires no developer, no platform subscription, and no client lock-in. It produces a single HTML file your client can open in any browser and see exactly what you are doing for them. You email them the file. They print it to PDF. They attach it to a board meeting. Same workflow as a paid platform. None of the cost.
This is what gets possible when you stop watching AI happen to your business and start building with it.
The Build. Four Prompts. One Afternoon.
The whole thing came together in four prompts inside a Claude project. Not a Claude chat. A Claude project, which means Claude already had context about who the dashboard was for, what tone the client expected, and what design rules to follow before any prompt ran.
That context lives in the project instructions. Things like "client audience is a business owner, not IT staff" and "no technical jargon" and "dark background, orange accent, plain English KPI labels." Five sentences of context. That is what makes four prompts enough instead of forty.
Here is the prompt sequence that produced the dashboard.
Prompt 1: The Skeleton
The first prompt sets the structural foundation. Layout, color scheme, navigation, KPI card placement. Get this right and every prompt after it has a frame to work inside.
Build the shell of a client-facing IT health dashboard as a single HTML file. Dark background, clean sans-serif font, no framework dependencies. The layout should have a top header bar with a company logo placeholder and a "Last updated" timestamp, a row of four KPI cards below the header, and a main content area with a chart placeholder on the left and an incident log table on the right. Make the KPI cards full width with good spacing. Design should look professional enough to show a business owner in a client meeting.
Claude returned a working HTML file with realistic placeholder labels. Not a mockup. Real, openable code.
Prompt 2: The KPI Cards
Now the actual content. Uptime, open tickets, patch compliance, security score. The four numbers a client actually wants to know.
Update the four KPI cards. Card 1: System Uptime, 99.7%, "30-day average," green indicator. Card 2: Open Tickets, 3, "2 low priority, 1 medium," yellow indicator. Card 3: Patch Compliance, 94%, "6 devices pending," yellow indicator. Card 4: Security Score, A, "No critical alerts," green indicator. Use actual colored circles for indicators, not emoji. Numbers should be the dominant visual element on each card.
Claude dropped these straight into the layout from the previous prompt. The security card came back with a slightly larger letter grade than I had asked for. That was actually better than my spec. I kept it.
Prompt 3: Chart and Incident Log
Two pieces left in the main content area. The trend chart and the incident table.
Add a thirty-day uptime trend chart using Chart.js, single line in orange, sample data between 99.2% and 100%, minimal axes. Add an incident log table with five sample rows. Columns: Date, Issue, Status, Resolved By. Use realistic incident descriptions like "VPN connectivity failure, remote user" and "Exchange mail delay, three users affected." Status is "Resolved" in green or "Monitoring" in yellow.
Claude wrote the Chart.js integration, pulled in the CDN, generated thirty data points, and rendered the line. None of that was typed by hand.
The incident descriptions are the part that surprised me. Not generic placeholders. Specific. Realistic. The kind of detail that makes a client say, "oh, you caught that." Because Claude had project context, it generated incidents that read like real IT support notes instead of filler.
Prompt 4: Branding and Export
Last prompt. This is the one that turns a demo into a deliverable.
Add three things. Header branding: replace logo placeholder with "Acme Corp" in white bold, tagline below reads "IT Health Report, Powered by [Your IT Company Name]." Add an "Export Report" button in the header in orange, triggers window.print() on click. Add a minimal footer with the report date and a contact line.
The export button is the move that makes this real. Click it, the print dialogue opens, save as PDF, attach to email. Done.
I did not write a PDF library. I did not configure a render service. Claude used the browser's native print API. Sometimes the simplest implementation is the right one.
What Came Out
One self-contained HTML file. No build step, no framework, no dependencies except Chart.js pulled from a CDN. Open it in any browser and it renders.
Header with the client name. Four KPI cards with status indicators. Trend line in orange. Incident log with realistic descriptions. Export button that produces a PDF in two clicks.
This is a real deliverable. Built in Claude. No developer involved. No license fee.
Total time, including the prompts above, the iteration on a few details, and the test in a browser: under an hour.
What Is Coming in Part 2
The HTML file is real, but it is static. It does not pull from your actual RMM. The data does not refresh on its own. To get to a live, hosted client portal you would put behind a URL, you need a real application.
Next Tuesday I take this exact HTML output, generate a product requirements document from it inside Claude, and drop the whole thing into Replit Agent. Replit Agent builds it as a hosted application. Real data connections. Live URL. Same dashboard, now an actual product.
That is Part 2. Same series. Same dashboard. Different tool.
Your Move
Open Claude. Start a new project. Paste the project context I described above into the project instructions. Then paste Prompt 1 exactly as written.
Save the HTML file Claude returns. Open it in a browser. That is your starting point.
If you can run the four prompts in sequence in under an hour, you have a deliverable you can hand to a client tomorrow. If you cannot, watch the full build walkthrough below and follow along with the actual screen capture.
Watch the full Part 1 walkthrough on YouTube: https://youtu.be/YM0bZBeuyH0
Part 2 publishes Tuesday May 19. Subscribe so you do not miss it.
If you want this built for your business without waiting for Part 2, that is what Orange Labs does. orangelabs.agency
Take the free AI Readiness Assessment to see exactly where your business sits on the curve from "watching AI happen" to "building with it." orangenomad.com/ai-assessment

Andrew Moon is the founder of Orange Nomad and the creator of the 3Cs Framework — a repeatable marketing system built for MSP owners under $5M who are great at IT but struggling to find clients. Not a marketer who learned about MSPs. An MSP owner who learned marketing — the hard way.